Inverse MACD + DMI Scalping with Volatility Stop (By Coinrule)This script is focused on shorting during downtrends and utilises two strength based indicators to provide confluence that the start of a short-term downtrend has occurred - catching the opportunity as soon as possible.
This script can work well on coins you are planning to hodl for long-term and works especially well whilst using an automated bot that can execute your trades for you. It allows you to hedge your investment by allocating a % of your coins to trade with, whilst not risking your entire holding. This mitigates unrealised losses from hodling as it provides additional cash from the profits made. You can then choose to hodl this cash, or use it to reinvest when the market reaches attractive buying levels.
Alternatively, you can use this when trading contracts on futures markets where there is no need to already own the underlying asset prior to shorting it.
ENTRY
The trading system uses the Momentum Average Convergence Divergence (MACD) indicator and the Directional Movement Index (DMI) indicator to confirm when the best time is for selling. Combining these two indicators prevents trading during uptrends and reduces the likelihood of getting stuck in a market with low volatility.
The MACD is a trend following momentum indicator and provides identification of short-term trend direction. In this variation it utilises the 12-period as the fast and 26-period as the slow length EMAs, with signal smoothing set at 9.
The DMI indicates what way price is trending and compares prior lows and highs with two lines drawn between each - the positive directional movement line (+DI) and the negative directional movement line (-DI). The trend can be interpreted by comparing the two lines and what line is greater. When the negative DMI is greater than the positive DMI, there are more chances that the asset is trading in a sustained downtrend, and vice versa.
The system will enter trades when two conditions are met:
1) The MACD histogram turns bearish.
2) When the negative DMI is greater than the positive DMI.
EXIT
The strategy comes with a fixed take profit combined with a volatility stop, which acts as a trailing stop to adapt to the trend's strength. Depending on your long-term confidence in the asset, you can edit the fixed take profit to be more conservative or aggressive.
The position is closed when:
Take-Profit Exit: +8% price decrease from entry price.
OR
Stop-Loss Exit: Price crosses above the volatility stop.
In general, this approach suits medium to long term strategies. The backtesting for this strategy begins on 1 April 2022 to 18 July 2022 in order to demonstrate its results in a bear market. Back testing it further from the beginning of 2022 onwards further also produces good returns.
Pairs that produce very strong results include SOLUSDT on the 45m timeframe, MATICUSDT on the 2h timeframe, and AVAUSDT on the 1h timeframe. Generally, the back testing suggests that it works best on the 45m/1h timeframe across most pairs.
A trading fee of 0.1% is also taken into account and is aligned to the base fee applied on Binance.
在脚本中搜索"stop loss"

The best scalping strategyPullbacks are always the most difficult part of trading, and when this happens, we struggle to make a decision about whether to continue trading and wait for a recovery or reduce losses. Similarly, when the instrument has a good trend, it is often difficult to make a decision if we want to withdraw some profit. This strategy is aimed at facilitating these decisions, it looks for price impulses and, based on this, calculates the pullback of the price at which it is necessary to place limit buy orders (yellow lines) based on Fibonacci levels. We place the stop loss on the red line, on the blue and pink lines it is necessary to put a take profit of 50% each. The entry and exit indicator does not always correctly display the entry and exit points, so it is necessary to work with limit orders.
-In the settings, you can change the number of candles participating in the cycle, if the price is at the same level for a long time and limit orders do not work, then it is recommended to reduce the number of candles.
-The remaining parameters are still under development, it is better not to touch them. In the future, I plan to add a limit on the amount of loss as a percentage, for more fine-tuning of risk management
Откаты всегда являются самой сложной частью торговли, и когда это происходит, мы изо всех сил пытаемся принять решение о том, продолжать ли торговлю и ждать восстановления или сократить убытки. Точно так же, когда инструмент имеет хороший тренд, часто трудно принять решение, если мы хотим снять некоторую прибыль. Эта стратегия направлена на то, чтобы облегчить эти решения, она ищет ценовые импульсы и исходя из этого рассчитывает по уровням фибоначи откат цены, на которых необходимо разместить лимитные ордера на покупку (желтые линии). Стоп-лос размещаем на красной линии, на синей и розовой линии необходимо поставить тэйк-профит по 50%. Индикатор входа и выхода не всегда корректно отображает точку входа и выхода, поэтому необходимо работать с лимитными ордерами.
-В настройках можно менять количество свечей участвующих в цикле, если цена долго находится на одном уровне и не срабатывают лимитные ордера то рекомендуются уменьшить количество свечей.
-Остальные параметры до сих пор находятся в разработке, их лучше не трогать. В дальнейшем планирую добавить ограничение размера убытка в процентах, для более тонкой настройки риск менеджмента

AT_MR-15m-ALGO Strategy IndicatorsThis strategy includes systems based on the return-to-mean method.
It creates BUY-SELL signals by getting approval from volatility, trend, momentum, volume, incompatibility and artificial intelligence formations in the system.
Unaffected by Pump and Dump (extreme spikes and dips). In some cases, it can turn this into an opportunity.
Our loss rates in transactions are minimized by algorithms. In other words, it has minimized the loss rates in the position with the stop loss systems and artificial intelligence in it.
IMPORTANT NOTE:
1-) In order for our indicator to be used efficiently, it is necessary to optimize its parameters on a monthly basis. It is offered to you by optimizing regularly by our technical team every month so that it can work efficiently in variable market conditions. Non-optimized systems do not work efficiently in new market conditions.
2-) Strategy should definitely be used on 15-minute charts. Otherwise, it will lead to losses!!!
Turkish Information:
Bu strateji ortalamaya geri dönüş metodu üzerine kurulmuş sistemleri içerir.
Sistem içerisindeki volatilite, trend, momentum, hacim, uyumsuzluk ve yapay zeka formasyonlarından onay alarak AL-SAT sinyallerini oluşturur.
Pump ve Dump(aşırı ani yükselişler ve düşüşler) durumlarından etkilenmez. Bazı durumlarda bunu fırsata çevirebilir.
İşlemlerdeki zarar oranlarımız algoritmalar tarafından minimize edilir. Yani, içerisinde bulunan zarar durdurma sistemleri ve yapay zeka ile pozisyondaki zarar oranlarını minimuma indirmiştir.
ÖNEMLİ NOT:
1-) İndikatörümüzün verimli bir şekilde kullanılabilmesi için her ay düzenli bir şekilde parametrelerinin optimizasyonunun yapılması gerekiyor. Değişken piyasa koşularında verimli çalışabilmesi için her ay düzenli olarak teknik ekibimiz tarafından optimizasyonu yapılarak sizlere sunulmaktadır. Optimize olmayan sistemler yeni piyasa koşullarında verimli çalışmazlar.
2-) Strateji kesinlikle 15 dakikalık grafiklerde kullanılmalıdır. Aksi taktirde kayıplara yol açacaktır!!!

Kifier's MFI/STOCH Hidden Divergence/Trend BeaterMFI/STOCH Hidden Divergence/Trend Beater
General Idea:
My premise around this strategy was to make a general strategy for crypto that would help out with finding entry positions for when you’re bullish on a crypto and want to hold on for a while, and at the same time avoiding massive drops. Essentially a way to mix long term/ swing trading; I somewhat achieved my goal however it still requires a lot of logic tuning of the trend averages.
I’m a huge proponent of volume indicators and coupled with average closing price, I think this gives a really good idea of what is happening with the market. It gives an idea on the market and retail investor sentiment. This generally gives you logical entry positions (Although I don’t know how amazing that will work with all cryptos, there’s a fine line between a good strategy and one that just rides bubble market conditions, some would argue that’s still a success and others not)
How it works:
There are many components to the strategy that try to do different things:
First of all there are two types of entries, a MFI hidden divergence with a STOCH check, essentially it will only fire when a divergence is detected while STOCH is above 50%, however this might be changed in the future as due to the volatile nature of cryptos, the STOCH is not too effective. The second entry is a simple MFI/STOCH trend, if STOCH is above 50% and the trend is detected to be in a trending long, once a MFI crossover over the 50% line is detected an entry is placed, this is designed to get out profit where the divergence would otherwise be less accurate during strongly trending conditions.
-MFI is a great indicator, as a volume weighted momentum indicator I find it the most accurate of all, the STOCH however is a great indicator to get a general picture of simple market conditions and can filter out the emotional noise of retail investors.
-VWMA and an SMA (The bottom oscillator) gives an idea of the trend tacking into account of the volume, this serves as a more short term filter of the trend for filters.
-OBV checks are done between the OBV and an EMA of the OBV, to get the idea of a volume weighted long trend, which is important for crypto as there are massive rallies to go up due to retail greed, it’s great to jump onto it at the beginning, and get off before the stack of cards fall apart.
-ATR is used to detect when the market is relatively just ranging or moving sideways, which is where the hidden divergence entries are done, during predictable and profitable market conditions.
- Stop loss is based on the closest support of the entry, this is a nice medium of room to breath but also an actual stop loss.
Future plans and improvements:
Currently there’s a lot I want to improve, mostly the divergence detection and the overall sharpe ratio could be much better, but the current value of 0.5 gives me hope that the strategy is onto something. I also want to change TP from a percentage stop to something more dynamic but that might be too optimistic. The current plan is to paper trade test this either by manual or by a python bot, to see how it performs with some user input as well.

Khair Day trade with profit lossBest used when applied for intraday trading. Users can customize length and deviation to fit their needs. Works best for high volatility stocks.
This strategy only works intraday intervals, so it means when you try to apply it to day/week/month it won't show any entry or exits.
Bollinger band breakout with non-standard deviation along with profit targets and stop loss.
There are 2 profit targets that can be adjusted based on individual preference.
This strategy minimizes risk and only opens trades when the probability of profitability is higher.

Godtrix's Crypto HA+RSI+EMA+ATH+DCA Strategy 3.0New Updates is here! Upgrade from previous version 2.0 (Please avoid using v2.0 as it's outdated.)
Great stability, Repaint bug fixes, and New features!
==================
| Introduction: |
==================
This is a Long Term Strategy, using compounding profit method, it can generate high returns, but it also risk for losses, this can be overcome if you set Stop Loss to over 25% for bitcoin & 60% for Altcoins.
Best profit plan with this strategy is you trade on Future leverage while you hold on to your coin, so that when price goes up, your coin value goes up, and at the same time, you trade with your leverage to earn even more, easily doubling up your total profit.
Benefits:
Fully customizable and you can easily personalized it and FINE TUNE it according to the market or coin you trading on.
The strategy is based on REAL PRACTICAL trading skills, so it works in real-world.
I fixed the "repainting" issue so the backtest it shows you IS ACCURATE when you run for real-time.
We all know one indicator is not going to help you win your trades, so this strategy combines ALL three: EMA for long+short term trend, HA for short term trend, RSI for entry/exit
This strategy is designed for LONG trade (Buy low, Sell high), not for SHORT trade.
This is not day trading, it is more to mid-term trading, where there's only few trades per month
Mainly is coded to work with 3Commas bot auto trading, so you only need to key in your Bot ID & Email Token.
Bot trading NOTE:
- You need to replace the Alert Message with this: {{strategy.order.alert_message}}
- And you'll need the Bot's webhook Url set with the Alert too.
- One Alert will work for both Buy and Sell Order
- If you using other Bot service, you can enter Custom Command in Input Settings too, it works on any bot service.
Lastly,
regarding the setting advice, I would say you try playing with different settings and your objective is to achieve a backtest result that has:
1) Profitable is > 80%
2) Losing trades is nearly 0 or below 25% of your winning trades. Trick is using far stop loss %
3) Net Profit be almost same or more than "Buy & Hold Profit"
==================
| Latest Updates: |
==================
=| Tidy Up Codings |=
- Group input fields so it'll be easier to understand and find the settings
- Upgrade code for obsolete 'transp' options
=| Repaint Issues |=
- Previous v2.0's RSI has repaint issue, creating false result against real-time data. I've fixed this.
- Also done fine-tuning other parts of the codes to prevent possible repaint issues.
=| Bot System |=
- Improved Custom Bot system, so that you're able to set dynamic order size/quantity with my custom keyword: and
Base Order Example:
{ 'message_type': 'bot', 'bot_id': 1234567, 'email_token': 'abcdefgh-1234-1234-1234', 'base_order': , 'delay_seconds': 0, 'pair': 'USDT_BTC'}
=| EMA Downtrend Exit |=
- Added option for you to decide whether to close position when detected EMA Long term downtrend.
=| EMA 2 (short term) is removed |=
- After several test, I've decided to remove this because it doesn't contribute to improving the results.
=| Heikin Ashi System |=
- Improved the chart display, now you'll see the HA candle 'shadowed' behind, so you'll see both actual price candle and HA candle at same time.
- Added the system that detect the HA candle sizes to decide specifically when it's suitable for Entry and Exit.
>> For "Entry/Exit Range"
- This means after HA is valid for Entry or Exit, how many following bars are allowed to stay valid so it will match other requirements to be completely fulfilled for Entry or Exit.
>> For "Crossing Interval"
- This means after detected HA line crossover, how many HA intervals is allow to Entry or Exit
>> For "Reversed Exit"
- This function let's you decide whether to close position if after HA bull (green candle) changed into HA Bear (red candle)
=| RSI A Entry |=
- Added option to avoid Entry during NTZ (No trade Zone)
- Also added the option to avoid next same condition RSI A entry too soon
=| RSI B Entry |=
- This function is for Entry if RSI is going very low, mostly due to bigger price drops in short time, it's good for buying DIP, however we'll never be able to know when a DIP ends, so do more test on this settings before put into real use.
- Added "avoid" options to help avoid getting Entry at "false" DIP, more like a short & fast pullback which causes RSI to drop very low but actually the price is near ATH or Recent High.
- Added option for Entry with Trailing Price Lower Buy combine with a limit order that grabs low price, so whichever it fulfill first.
=| New: Avoid Entry |=
- Well, it's a pain if you bought at the top, so I've added two options that will avoid buying near ATH and Recent High.
=| Time-limit Removed |=
- Sorry that I've missed look on the script policy which I'm not allowed to put a time-limit for public scripts.
=| System Improvements |=
- HA condition detection is optimized and bug fixed
- RSI values now reads accurately on each bar despite using higher timeframe, especially when moving to next interval
=| New: Dollar Cost Averaging (DCA) Orders |=
- Although DCA strategy is not appealing for Long term strategy, but I've added it for your extra options and flexibilities.
- The settings are quite straight-forward and standard, so I won't be explaining here.
=| New: Backtest Start & End Date |=
- This is very good function when you need more accurate result starting at specific date & time.
- Also if you set the date & time for your real trading starts, it'll much result the same as your actual trading records, which helps you to see clearer and make future decisions.
Any found bugs or flaws, please feel free to PM me, I can't get notifications from comments here below, so I'll not able to reply you the soonest possible, still not sure how to turn on notification for comments, anyone who knows can PM and teach me, lol... Thanks in advance!
Well, this is free version, hope it helps! Feedbacks are all welcome :)
(To Moderators: I've fully use the "f_security()" guideline, but instead of creating a separate function, I apply directly on all security() function. Please don't ban my script before fully check if I've truly fixed repaint. Thank you.)
BITSTAMP:BTCUSD COINBASE:BTCUSD COINBASE:ETHUSD BINANCE:BNBUSDT

Bollinger Band with RSI
Using combination bollinger band and RSI indicator as guide to predict price volatility and the best entry point. The strategy logic is pretty straightforward where we're interested with close price that touches the lower bollinger band ; there are only two scenarios that will happened after the price reaches the lower band; the price might rebound from the lower bollinger band or drop lower and continue downtrend. To confirm the price movement, we use a second indicator which is the RSI to further investigate the price trend. For example, if the price reaches the lower bollinger band but the RSI value is not in the oversold region, we can conclude that the price will go lower and continue downtrend. If the RSI value is in the oversold region, we can use this price area as our entry point.
Stop loss is necessary to avoid losing too much capital if the RSI value lingers too long in the oversold region.
Best take profit area is when the price rebound above the middle bollinger band area/upper bollinger band or when the RSI reaches overbought region; whichever comes first.
Long entry:
RSI < 30 & close price < lower bollinger band
Exit entry:
RSI > 70
Default stop loss: -25%

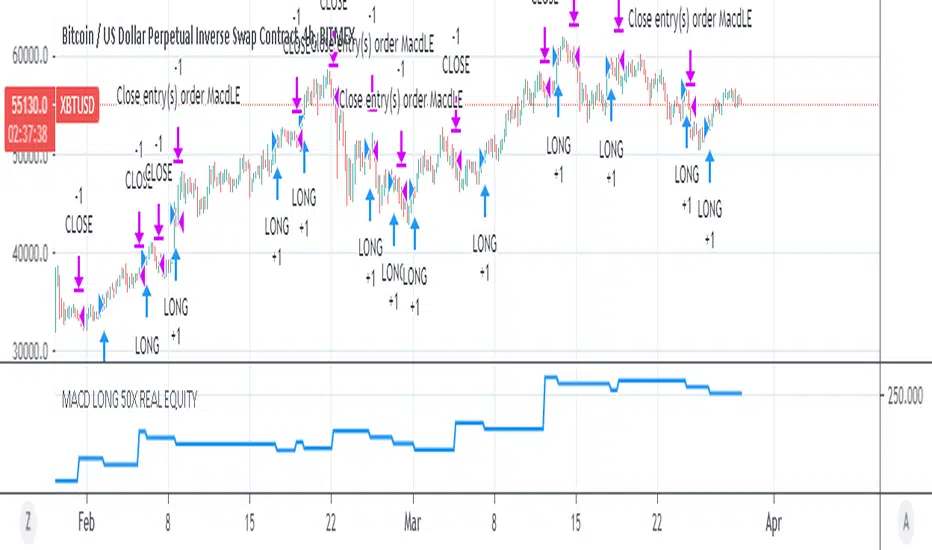
MACD 50x Leveraged Short Strategy with Real Equity
Hello there ,
Short version of the Macd Long strategy.
MACD Long strategy:
Adding margin: Forbidden or not specified. (Add Margin : No)
Position size: (for each trade) 1%
Stop-Loss: (2% Above Entry Level)
Long: macd crossunder
Exit: macd crossover
Or ofc touching the stop-Loss value as predicted.
These strategies are just examples.
The goal is to observe true equity and equity change.
Warning: This strategy simulation is for Short direction only.
Regards.

MACD 50x Leveraged Long Strategy Results with Real Equity Hello there.
I was looking for a way to simulate leveraged transactions in Tradingview and this script came out.
You can examine the equity graph without looking at the strategy results.
Thus, the facts will come to light.
Strategy parameters:
Adding margin: Forbidden or not specified. (Add Margin : No)
Position size: (for each trade) 1%
Stop-Loss: (2%)
Long: macd crossover
Exit: macd crossunder
Or ofc touching the stop-Loss value as predicted.
Warning: This strategy simulation is for Long direction only.
Regards.
Low volatility Buy w/ TP & SL (Coinrule)The compression of volatility usually leads to expansion. When the breakout comes, it can ignite strong trends. One way to catch a coin trading in an accumulation area is to spot three moving averages with values close to each other. The strategy uses a combination of Moving Averages to spot the best time to buy a coin before its breakout.
Buy Condition
The MA200 is greater than the MA100
The MA50 is greater than the MA100
According to backtesting results, the 1-hour time frame is the best to run this strategy.
Sell Condition
Take Profit: the price increases 8% from the entry price
Stop Loss: the price drops 4% from the entry price
The strategy has a profitability of 40-60% (depending on the market conditions). Having a ratio of two between Take profit and Stop Loss helps keeping the strategy profitable in the long term.

Triple EMA Scalper low lag stratHi all,
This strategy is based on the Amazing scalper for majors with risk management by SoftKill21
The change is in lines 11-20 where the sma's are replaced with Triple ema's to
lower the lag.
The original author is SoftKill21. His explanation is repeated below:
Best suited for 1M time frame and majors currency pairs.
Note that I tried it at 3M time frame.
Its made of :
Ema ( exponential moving average ) , long period 25
Ema ( exponential moving average ) Predictive, long period 50,
Ema ( exponential moving average ) Predictive, long period 100
Risk management , risking % of equity per trade using stop loss and take profits levels.
Long Entry:
When the Ema 25 cross up through the 50 Ema and 100 EMA . and we are in london or new york session( very important the session, imagine if we have only american or european currencies, its best to test it)
Short Entry:
When the Ema 25 cross down through the 50 Ema and 100 EMA , and we are in london or new york session( very important the session, imagine if we have only american or european currencies, its best to test it)
Exit:
TargetPrice: 5-10 pips
Stop loss: 9-12 pips

TrendMaAlignmentStrategy - Long term tradesThis is another strategy based on moving average alignment and HighLow periods. This is more suitable for long term trend traders and mainly for stocks.
Candle is colored lime if : Lookback Period has at least one bar with moving averages fully aligned OR None of the bars in Lookback periods has negatively aligned moving averages (More than half are positively aligned).
Candle is colored orange if : Lookback Period has at least one bar with moving averages fully aligned in negative way OR none of the bars in lookback has positively aligned moving averages (More than half are negatively aligned).
If either of above conditions are met, candle is colored silver.
Moving average alignment parameters:
Moving Average Type : MA Type for calculating Aligned Moving Average Index
Lookback Period : Lookback period to check highest and lowest Moving Average index.
HighLow parameters:
Short High/Low Period: Short period to check highs and lows
Long High/Low Period: Longer Period to check highs and lows.
If short period high == long period high, which means, instrument has made new high in the short period.
ATR Parameters:
ATR Length: ATR periods
StopMultiplyer: To set stop loss.
ReentryStopMultiplyer: This is used when signal is green buy stop loss on previous trade is hit. In such cases, new order will not be placed until it has certain distance from stop line.
Trade Prameters:
Exit on Signal : To be used with caution. Enabling it will allow us to get out on bad trades early and helps exit trades in long consolidation periods. But, this may also cause early exit in the trend. If instrument is trending nicely, it is better to keep this setting unchecked.
Trade direction : Default is long only. Short trades are not so successful in backtest. Use it with caution.
Backtest years : limit backtesting to certain years.
Part of the logic used from study's below:
Other strategies based on these two studies are below (which are meant for short - medium terms):

Amazing scalper for majors with risk managementHello,
Today I am glad to bring you an amazing simple and efficient scalper strategy.
Best suited for 1M time frame and majors currency pairs.
Its made of :
Ema (exponential moving average) , long period 25
Ema(exponential moving average) Predictive, long period 50,
Ema(exponential moving average) Predictive, long period 100
Risk management , risking % of equity per trade using stop loss and take profits levels.
Long Entry:
When the Ema 25 cross up through the 50 Ema and 100 EMA. and we are in london or new york session( very important the session, imagine if we have only american or european currencies, its best to test it)
Short Entry:
When the Ema 25 cross down through the 50 Ema and 100 EMA, and we are in london or new york session( very important the session, imagine if we have only american or european currencies, its best to test it)
Exit:
TargetPrice: 5-10 pips
Stop loss: 9-12 pips
Hope you enjoy it :)

[HTI2] Hiubris Trend Indicator 2 StrategyThis is the Strategy version of the HTI2 Indicator
After testing several strategies for months and comparing them to the standard 'Buy and Hold' method, we've found the best performing strategy for BTCUSDT
We simplified it to make it more user-friendly (We've only added 1 optional exit: a % SL) and left all the inputs adjustable, so it can be optimized for ANY pair!
This is a Trend Indicator! This means that the '% Profitable Trades' is not the main focus, but catching every trend swing. When trying to catch every trend swing, naturally alot of the them might be unprofitable, especially in sideways markets. The idea behind this strategy is to catch all the significant trend movements, which are alot more profitable than all the 'sideway market' losses
For that reason, we recomment backtesting on Timeframes greater than 15min. Initially we suggest you backtest without a Stop-Loss, trying multiple combinations of the 2 inputs (Length 9 to 32 / Multiplier 2 to 12)
After you found a profitable enough combination, you should look at the 'Average Losing Trade' and the 'Largest Losing Trade', then try further improving the results by setting up a Stop-Loss accordingly (if needed)
In our case, we've found that having a 2% SL (on BTCUSDT) really helps alot with those sideways market trend swings. This also allows us to comfortably us a 10x leverage
*** When using the Re-Entry feature, make sure to change the order size to contracts! Do not leave is as '% of Account' !!! ***
Some of our backtesting results
BTCUSDT 30-5 30min, 2% SL vs 'Buy and Hold'
2019 - present 697.42% vs 250%
2018 - 2019 119.42% vs -75%
EURUSD 18-6 30min, 0.6% SL
2019 - present 12.4%
AMZN 13-2 30min, 2% SL
2019- present 279.44%
XAUUSD 18-3 30min, 1.75% SL
2019- present 53.43%
BA 20-6 30min, 1.5% SL
2019- present 251.35%

[BoTo] Pump&Dump StrategyThis strategy uses only long positions. It isn't used short positions, it doesn't use marginal trade, it doesn't use a pyramiding.
It is strategy uses only one indicator. Ourselves have constructed the indicator for cryptocurrencies. We called it 'Pump&Dump Ocsilator'. You can read as this indicator works here:
Not usual stop
Strategy uses 2 ways for closing of an unprofitable position. But it is possible to use only one way.
Way 1: if the indicator has distinguished a dump, then the long position needs to be closed when the candle is closed (for an example: to close a position when time 00:00 if you have chosen daily timeframe)
Way 2: the user himself chooses the size in settings of this script. Percent. If the user has chosen 100%, means isn't used absolutely. Because the price will never fall by 100%. If the user has chosen less than 100%, for example 5%, then the long position needs to be closed if the low of a candle was less than this price level of choosed stop-loss. But the position needs to be closed too when the candle is closed.
Strategy
A pump-signal: if the candle green and her body is 3 times more than norm
A dump-signal: on the contrary, if the candle red and her body is 3 times more than norm
For opening of a long position: it is necessary any pump-signal (if the position hasn't been open yet)
For closing of a long position: several ways:
1) Or any dump-signal is necessary
2) Or a stop-loss which was chosen by the user is necessary

Millionare tool1. No lag, proprietary algorithm gives signal when position is triggered.
2. Ideal for ones who have tight stop losses but book profits very soon and miss the BIG move.
3. Works on Intraday/ positional/investment long term
4. Works on INDEX/ EQUITY/ FOREX/ CRYPTO CURRENCY
5. Works in any market all over the world, USA,LONDON, JAPAN,INDIA etc
6. 5d,1m,3m ,6m,1yr,5yr no problem.
7. Ideal for trend traders who want to catch the biggest move
8. All human emotions/temptations, silly indicators are out, get the signal? take the entry. simple as ABC
9.Use a breakeven stop loss or max 0.3%, never have a big loss, only big profits
*BUY on long signal, book profits when content, or on next short signal, can initiate fresh shorts too.
*Works in all markets mentioned
*Its your best friend to catch the trend. money
Some examples-
1) postimg.org
2) postimg.org
3) postimg.org
4) postimg.org
5) postimg.org

MACDouble & StochRSI w/ safeties and variable time interval v0.3UPDATE:
IMPORTANT!!! MAKE SURE "RECALCULATE AFTER ORDER FILLED" IS CHECKED. I will have it on by default in the future.
This is a continuation of my previous scripts of two MACD indicators with a Stochastic RSI indicator.
New features:
- Alternate MACD time interval
You can now set the time interval for the second MACD indicator to a different resolution than the displayed chart.
Uncheck the box and select the desired interval. For example, if your chart is set to 15min then first MACD will be set at 15 min and you can select 5 min for the second MACD.
- Alternate StoRSI time interval
You can (and should) set the StochRSI to a different time interval as well. StochRSI hasn't worked great with previous versions. Now you can set it to a different time resolution as well. I strongly recommend you set it at a higher (slower) resolution; for example if your chart is set at 15min then you should test setting the StochRSI at 30 or 45min.
- ' True" StochRSI logic
Trading logic for StochRSI is now a true StochRSI, instead of just reading "k" and ignoring "d", K now has to be greater than D to buy and less than to sell.
- Safeties
A primitive but low risk safety in the form of an uptrend/downtrend price safety. If current close+high isn't greater than the previous close and high then the buy order will not be executed. The same applies for sell orders.
- Cap on losses from short positions
A stop loss safety set to 9000 for exiting sell positions. This will need refinement in the future but this puts a cap on losses from any sell position. At an initial currency of 10,000 this translates to 90.00. If it is giving you problems simply delete line 78 from the source code.
Please feel free to ask any questions or send me suggestions. This is still very much a work in progress and I'll try to polish up the rough spots but it is fully functional. With a slower StochRSI and the safeties I have gotten it to consistently outperform the old 2x MACD strategy script---typically by 3-fold.

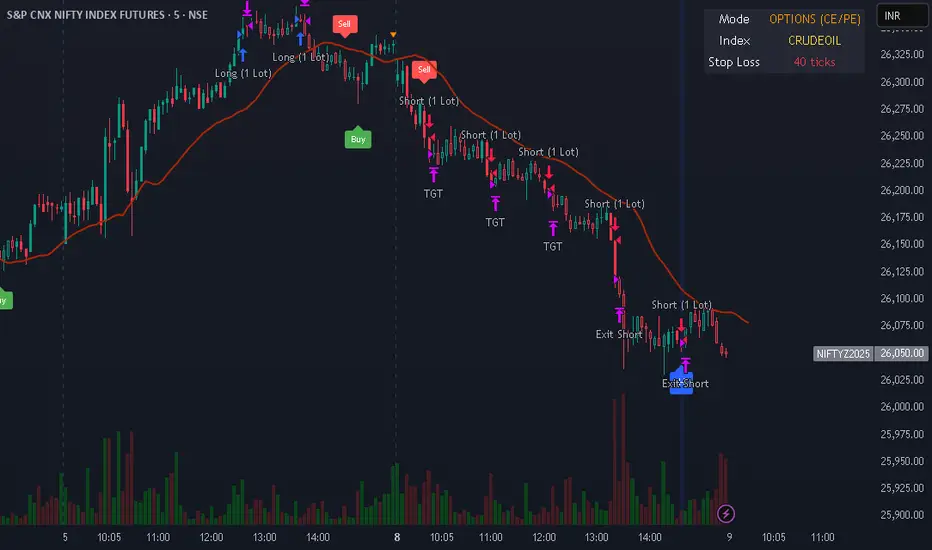
Intraday Options/Futures Naked By TradeEarnIntraday Momentum Strategy (Futures & Options)
Description: This strategy is designed for intraday momentum trading on Indian Indices (Nifty, BankNifty, FinNifty, Sensex) and Crude Oil. It combines Price Action (Impulse Candles) with strictly defined Momentum (RSI) and Trend Strength (ADX) indicators to filter out choppy markets and capture high-probability moves.
Key Features:
Instrument Flexibility: Supports both Futures (Long/Short) and Options Buying (Long CE/PE) modes.
Auto-Lot Sizing: Automatically calculates the correct Lot Size based on the selected Index (e.g., Nifty = 25, BankNifty = 15).
Rupee-Based Risk Management: Define Target, Stop Loss, and Trailing Stop directly in INR (Rupees) rather than points or percentages.
Choppiness Filter: Uses ADX > 20 to avoid trading in sideways markets.
Cooldown Mechanism: Incorporates a "Cooldown" period after every trade exit to prevent over-trading and whipsaws.
⚠️ Disclaimer (As per SEBI & RBI Guidelines)
Educational Purpose Only: This strategy/script is for educational and backtesting purposes only. It does not constitute financial advice, investment recommendations, or a tip to buy or sell any securities.
Risk Disclosure:
Market Risk: Trading in the stock market, especially in Derivatives (Futures & Options), involves a high degree of risk and the potential for significant financial loss. You may lose your entire capital.
No Guarantees: Past performance of this strategy (Backtest results) is not indicative of future results. Market conditions change, and algorithms may fail during live execution.
SEBI Registration: The creator of this script is not a SEBI Registered Investment Advisor (RIA) or Research Analyst (RA).
User Responsibility: By using this script, you acknowledge that you are solely responsible for your own trading decisions. Please consult a SEBI-registered financial advisor before deploying real capital. This script is not compliant with high-frequency trading regulations and is intended for manual or semi-automated analysis only.
Inyerneck Quiet Bottom Hunter v36 — Last Sorta-Working VersionQuiet Bottom Hunter v36 — Accurate Description (the sorta-working version that fires signals)
Overview
A mean-reversion bottom-hunting strategy for small-cap stocks (<$2B market cap). Designed to catch slow-bleed stocks that quietly bottom out and rebound 20–60%+. Good for beginners because signals are infrequent and the setup is easy to understand.
Timeframe
Daily (D) — best results on 1-day charts. Works on weekly too, but signals are rarer.
Triggers / Conditions (all must be true at bar close)
Drop from high ≥ 25% from the highest high in the last 100 bars (previous bars only — no repainting)
Volume ≤ 80% of the 50-day average (quiet accumulation, no panic selling left)
RSI(14) ≤ 38 (oversold territory)
Green/flat streak ≥ 2 consecutive days where close ≥ open (shows sellers are exhausted)
When all four line up → tiny green “QB” triangle below the bar
Firing Frequency
1–4 signals per month on an average small-cap stock (depends on market conditions). Some months zero, some months a handful. Not spammy, but not ultra-rare either.
Usage Parameters
Position size: 10% of equity per trade (default — change to 5–20% depending on risk tolerance)
Profit target: 40%
Stop loss: 12%
Hold time: usually 2–8 weeks
Best on low-float, high-volatility small caps (TLRY, SNDL, MVIS, SOUN, INHD, etc.)
Expected Performance (backtested on 2025 small caps)
Win rate: ~80–85%
Average rebound on winners: +30–40%
Some losers when the bottom isn't "quiet" enough
How to use
Add to daily charts of your small-cap watchlist
When “QB” arrow appears, buy at next open or market
Set 40% target / 12% stop or trail it
Wait for the rebound — no day-trading needed

Triple Screen Scalper [Pro] + Dynamic Risk Engine + Smart DCA🚀 Strategy Concept
This algorithm utilizes a Triple Screen methodology to filter market noise and align trades with the path of least resistance. Instead of relying on a single timeframe, it analyzes market structure across three distinct "horizons" to ensure high-probability execution:
The Tide (Long-Term): Analyzes the dominant directional flow and market bias on higher timeframes.
The Wave (Medium-Term): Measures the strength of the current momentum and pauses trading during weak or "choppy" market phases.
The Ripple (Short-Term): Pinpoints precise entry zones by detecting over-extended price action and mean-reversion opportunities within the larger trend.
The system is fortified with a Smart DCA (Dollar Cost Averaging) Engine that adapts to volatility. It does not blindly add to positions; it calculates "Risk Room" and "Trend Stability" before every additional entry, ensuring capital is deployed efficiently rather than recklessly.
⚙️ Configuration Guide (Variable Explanations)
💰 Position & Leverage
Trade Direction: Choose between Long, Short, or Auto. In "Auto," the system trades both directions based on the dominant trend.
Target Entry Leverage (x): The desired leverage for your initial entry.
Base Order Size (% of Equity): How much of your account balance is allocated to the very first trade of a sequence.
DCA Size Multiplier: Controls how much larger each subsequent order is compared to the previous one. A value of 1.0 means flat sizing; values above 1.0 increase the size of recovery orders.
KILL SWITCH: Max Effective Lev: A safety ceiling. If your total position's effective leverage exceeds this value, the strategy will force-close the position to prevent liquidation.
🚀 Profit Settings (Dynamic Exits)
Use Dynamic Profit?: If enabled, the take-profit target acts like a breathing lung—expanding during high volatility (to catch bigger moves) and contracting during quiet periods.
Gain Volatility Length: The lookback period used to measure recent market volatility.
Gain Multiplier: Scales the profit target. Higher numbers require a larger price move to hit profit; lower numbers take profit sooner.
Minimum Profit Floor %: A hard limit ensuring the target never drops below this percentage, even in extremely low-volatility markets.
📉 Trend & Momentum Filters
Trend Strength Threshold: Defines the minimum "velocity" required to trade. This filters out flat, ranging markets where trends are not established.
Momentum Sensitivity (K/D/Smooth): These variables tune the sensitivity of the entry trigger.
Lower numbers = Faster entries (more trades, potentially more noise).
Higher numbers = Slower, more confirmed entries.
Overbought / Oversold Levels: The specific zones (0-100) where price is considered statistically over-extended, triggering a reversal signal.
🛡️ Risk & DCA Settings
Enable Hard Stop Loss: A traditional safety stop based on a fixed percentage.
Max DCA Orders: The maximum number of times the strategy is allowed to "average down" on a position.
Require Trend for DCA?: If TRUE, the strategy will only add to a losing position if the broader market trend is still valid. If the trend breaks, it stops buying.
DCA Volatility Length/Multiplier: Controls the spacing between buy orders.
High Multiplier = Orders are spread far apart (safer for crashes).
Low Multiplier = Orders are closer together (faster recovery in normal dips).
Risk Scaling: A unique feature that pushes DCA orders further away as your leverage increases, protecting you from adding too much risk too quickly.
Base DCA %: The minimum distance required between orders, regardless of volatility.
⏱️ Timers & Cooldowns
Fast / Slow Cooldown: The minimum time (in seconds) the strategy must wait between realizing a profit and opening a new trade. This prevents "revenge trading" or entering twice on the same candle.
Position Cooldown: A specific timer applied after a large position is closed to let the market settle.
🎯 Daily S/R Targets
Enable Daily S/R: If enabled, the strategy will attempt to "snipe" exits at calculated daily support and resistance pivots.
Proximity Threshold: How close the price must get to a daily level to trigger an early exit.
⚠️ Risk Disclaimer
This script is an automated tool for analysis and execution assistance. It employs averaging techniques (DCA) which involve calculated risk. While the "Kill Switch" and "Risk Scaling" features are designed to mitigate exposure, users should thoroughly backtest and understand the "Multiplier" settings before deploying real capital. Past market structure is not a guarantee of future performance.

The Oracle: Dip & Top Adaptive Sniper [Hakan Yorganci]█ OVERVIEW
The Oracle: Dip & Top Adaptive Sniper is a precision-focused trend trading strategy designed to solve the biggest problem in swing trading: Timing.
Most trend-following strategies chase price ("FOMO"), buying when the asset is already overextended. The Oracle takes a different approach. It adopts a "Sniper" mentality: it identifies a strong macro trend but patiently waits for a Mean Reversion (pullback) to execute an entry at a discounted price.
By combining the structural strength of Moving Averages (SMA 50/200) with the momentum precision of RSI and the volatility filtering of ADX, this script filters out noise and targets high-probability setups.
█ HOW IT WORKS
This strategy operates on a strictly algorithmic protocol known as "The Yorganci Protocol," which involves three distinct phases: Filter, Target, and Execute.
1. The Macro Filter (Trend Identification)
* SMA 200 Rule: By default, the strategy only scans for buy signals when the price is trading above the 200-period Simple Moving Average. This ensures we are always trading in the direction of the long-term bull market.
* Adaptive Switch: A new feature allows users to toggle the Only Buy Above SMA 200? filter OFF. This enables the strategy to hunt for oversold bounces (dead cat bounces) even during bearish or neutral market structures.
2. The Volatility Filter (ADX Integration)
* Sideways Protection: One of the main weaknesses of moving average strategies is "whipsaw" losses during choppy, ranging markets.
* Solution: The Oracle utilizes the ADX (Average Directional Index). It will BLOCK any trade entry if the ADX is below the threshold (Default: 20). This ensures capital is only deployed when a genuine trend is present.
3. The Sniper Entry (Buying the Dip)
* Instead of buying on breakout strength (e.g., RSI > 60), The Oracle waits for the RSI Moving Average to dip into the "Value Zone" (Default: 45) and cross back up. This technique allows for tighter stops and higher Risk/Reward ratios compared to traditional breakout systems.
█ EXIT STRATEGY
The Oracle employs a dynamic dual-exit mechanism to maximize gains and protect capital:
* Take Profit (The Peak): The strategy monitors RSI heat. When the RSI Moving Average breaches the Overbought Threshold (Default: 75), it signals a "Take Profit", securing gains near the local top before a potential reversal.
* Stop Loss (Trend Invalidated): If the market structure fails and the price closes below the 50-period SMA, the position is immediately closed to prevent deep drawdowns.
█ SETTINGS & CONFIGURATION
* Moving Averages: Fully customizable lengths for Support (SMA 50) and Trend (SMA 200).
* Trend Filter: Checkbox to enable/disable the "Bull Market Only" rule.
* RSI Thresholds:
* Sniper Buy Level: Adjustable (Default: 45). Lower values = Deeper dips, fewer trades.
* Peak Sell Level: Adjustable (Default: 75). Higher values = Longer holds, potentially higher profit.
* ADX Filter: Checkbox to enable/disable volatility filtering.
█ BEST PRACTICES
* Timeframe: Designed primarily for 4H (4-Hour) charts for swing trading. It can also be used on 1H for more frequent signals.
* Assets: Highly effective on trending assets such as Bitcoin (BTC), Ethereum (ETH), and high-volume Altcoins.
* Risk Warning: This strategy is designed for "Long Only" spot or leverage trading. Always use proper risk management.
█ CREDITS
* Original Concept: Inspired by the foundational work of Murat Besiroglu (@muratkbesiroglu).
* Algorithm Development & Enhancements: Developed by Hakan Yorganci (@hknyrgnc).
* Modifications include: Integration of ADX filters, Mean Reversion entry logic (RSI Dip), and Dynamic Peak Profit taking.

Mean Reversion — BB + Z-Score + RSI + EMA200 (TP at Opposite Z)This is a systematic mean-reversion framework for index futures and other liquid assets.
This strategy combines Bollinger Bands, Z-Score dislocation, RSI extremes, and a trend-filtering EMA200 to capture short-term mean-reversion inefficiencies in NQ1!. It is designed for high-volatility conditions and uses a precise exit model based on opposite-side Z-Score targets and dynamic mid-band failure detection.
🔍 Entry Logic (Mean Reversion) :
The strategy enters trades only when multiple confluence signals align:
Long Setup
Price at or below the lower Bollinger Band
Z-Score ≤ –Threshold (deep statistical deviation)
RSI ≤ oversold level
Price below the EMA-200 (countertrend mean-reversion only)
Cooldown must be completed
No open position
Short Setup
Price at or above the upper Bollinger Band
Z-Score ≥ Threshold
RSI ≥ overbought level
Price above the EMA-200
Cooldown complete
No open position
This multi-signal gate filters out weak reversions and focuses on mature dislocations.
🎯 Take-Profit Model: Opposite-Side Z-Score Target :
Once in a trade, take-profit is set by solving for the price where the Z-Score reaches the opposite side:
Long TP = Z = +Threshold
Short TP = Z = –Threshold
This creates a symmetric statistical exit based on reverting to equilibrium plus overshoot.
🛡️ Stop-Loss System (Volatility-Aware) :
Stop losses combine:
A fixed base stop (points)
A standard-deviation volatility component
This adapts the SL to regime changes and avoids being shaken out during rare volatility spikes.
⏳ Half-Life Exit :
If a trade has not reverted within a fixed number of bars, it automatically closes.
This prevents “mean-reversion traps” during trending periods.
📉 Advanced Mid-Band Exit Logic (BB Basis Failure) :
This is the unique feature of the system.
After entry:
Wait for price to cross the Bollinger Basis (middle band) in the direction of the mean.
Start a 5-bar delay timer.
After 5 bars, the strategy becomes “armed.”
Once armed:
If price fails back through the mean, exit immediately.
Intrabar exits trigger precisely (with tick-level precision if Bar Magnifier is enabled).
This protects profits and exits trades at the first sign of mean-failure.
⏱️ Cooldown System :
After each closed trade, a cooldown period prevents immediate re-entry.
This avoids clustering and improves statistical independence of trades.
🖥️ What This Strategy Is Best For :
High-volatility intraday NQ conditions
Statistical mean reversion with structured confluence
Traders who want clean, rule-based entries
Avoiding trend-day traps using EMA and half-life logic
📊 Included Visual Elements :
Bollinger Bands (Upper, Basis, Lower)
BUY/SELL markers at signal generation
Optional alerts for automated monitoring
🚀 Summary :
This is a precision mean-reversion system built around volatility bands, statistical dislocation, and price-behavior confirmation. By combining Z-Score, RSI, EMA200 filtering, and a sophisticated mid-band failure exit, this model captures high-probability reversions while avoiding the common pitfalls of naive band-touch systems.

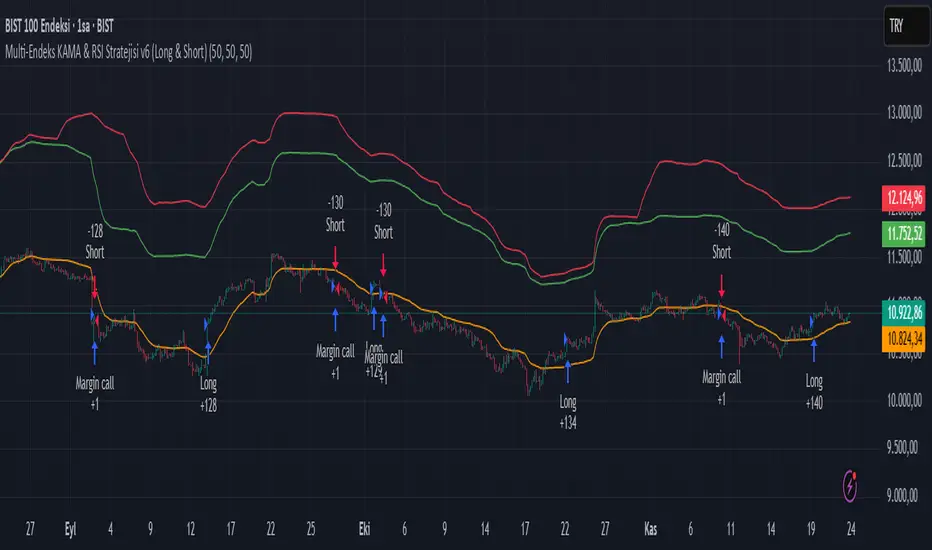
Multi-Endeks KAMA & RSI Stratejisi v6 (Long & Short)Multi-Index KAMA & RSI Strategy v6 (Long & Short)
This is a hybrid trading strategy that combines two powerful technical analysis tools—the Kaufman's Adaptive Moving Average (KAMA) for trend following and the Relative Strength Index (RSI) for measuring momentum and identifying overbought/oversold conditions.
The term "Multi-Index" suggests that the decision-making process might incorporate data or conditions from several different market indices or timeframes, rather than just the single asset being traded.
🧭 Core Components
1. KAMA (Kaufman's Adaptive Moving Average)
KAMA is an adaptive moving average developed by quantitative financial theorist Perry J. Kaufman.
Adaptivity: Unlike standard moving averages, KAMA automatically adjusts its smoothing factor (speed) based on market volatility.
Mechanism:
Trending Markets (Low Noise): When prices move clearly in one direction (low volatility), KAMA speeds up, hugging the price closely and providing fast signals.
Sideways Markets (High Noise): When prices are choppy (high volatility/noise), KAMA slows down, smoothing out price fluctuations to reduce the risk of whipsaws (false signals).
Role in Strategy: To define the main trend direction. The position of the price relative to the KAMA line determines the base directional bias (Long or Short).
2. RSI (Relative Strength Index)
RSI is a momentum oscillator developed by J. Welles Wilder Jr. that measures the speed and change of price movements.
Overbought/Oversold: It oscillates between 0 and 100. Conventionally, a reading above 70 suggests overbought conditions (potential sell signal), and a reading below 30 suggests oversold conditions (potential buy signal).
Role in Strategy: Timing and Confirmation. Once the trend is confirmed by KAMA, the RSI acts as a timing filter, often confirming an entry as it moves away from extreme overbought (for Short) or oversold (for Long) levels.
📉 Potential Trading Logic (V6)
This "v6" strategy likely aims to capture more reliable entries by requiring both trend (KAMA) and momentum (RSI) alignment:
1. LONG (Buy) Entry Conditions
Trend Confirmation (KAMA): The asset's price (Closing Price) must be above the KAMA line (confirming an uptrend).
Momentum Confirmation (RSI):
Option A (Reversal): The RSI must cross above the 30 level (exiting oversold) or decisively move above the 50 level.
Option B (Trend-Continuation): In a strong uptrend, the RSI might bounce off the 40-50 zone and turn upwards, confirming trend continuation.
2. SHORT (Sell) Entry Conditions
Trend Confirmation (KAMA): The asset's price (Closing Price) must be below the KAMA line (confirming a downtrend).
Momentum Confirmation (RSI):
Option A (Reversal): The RSI must cross below the 70 level (exiting overbought) or decisively move below the 50 level.
Option B (Trend-Continuation): In a strong downtrend, the RSI might be rejected from the 50-60 zone and turn downwards, confirming continuation.
3. Exit Management
The strategy likely utilizes dynamic risk controls:
Stop-Loss: A dynamic stop placed on the opposite side of the KAMA, or an ATR-based distance to adjust to volatility.
Take-Profit: Conditions such as the RSI reaching extreme levels or the KAMA line being crossed in the reverse direction.
🌟 Implication of the "V6" Version
The "v6" designation implies that the strategy has been refined and iterated upon over time to address weaknesses in prior versions (v1, v2, etc.). These improvements might include:
Filters: Adding stricter RSI or KAMA cross filters to reduce false signals.
Multi-Index Logic: Using the RSI or KAMA of a secondary instrument (e.g., a major index or volatility measure) as a macro filter for the main trade execution.
Optimization: Optimizing the default lookback periods for KAMA and RSI for different asset classes.